




Energy Visibility & Analytics

Real-time energy monitoring and advanced analytics that improve performance, reduce cost and strengthen compliance.

Talk to Us today

Understanding Your Energy Data

Understanding how, when and where electricity is being used is the foundation of effective energy management.

Quasar helps organisations turn electrical data into actionable insights through advanced energy monitoring, analytics, dashboards and reporting.

Our solutions provide real-time visibility across commercial buildings, industrial facilities and critical infrastructure, helping identify inefficiencies, reduce costs, support compliance and improve operational performance.

How Energy Visibility Creates Value

Typical outcomes include reduced energy costs, improved reporting, greater operational visibility and better-informed investment decisions.
Blue target with an arrow in the bullseye and an X mark overlapping the bottom right.

Energy Monitoring

Real-time visibility across sites and assets.
Blue bar chart with fluctuating arrow lines showing upward and downward trends.

Usage Analytics

Understand consumption and demand trends.
Blue eye icon with a diagonal slash, representing hidden or invisible content.

Reporting & Dashboards

Automated reporting and actionable insights.
Blue gear with dollar sign inside a declining arrow, symbolizing financial loss or cost reduction.

Cost Reduction

Identify savings and efficiency opportunities.
Icon of a person teaching two seated people in front of a board.

Multi-Site Visibility

Centralise performance across portfolios.
Blue circuit board lines with circular nodes on a black background.

SE Technologies

Built on industry-leading technology.

Common Use Cases

See how organisations use energy visibility and analytics to improve performance, reduce costs and make better-informed decisions across their operations.
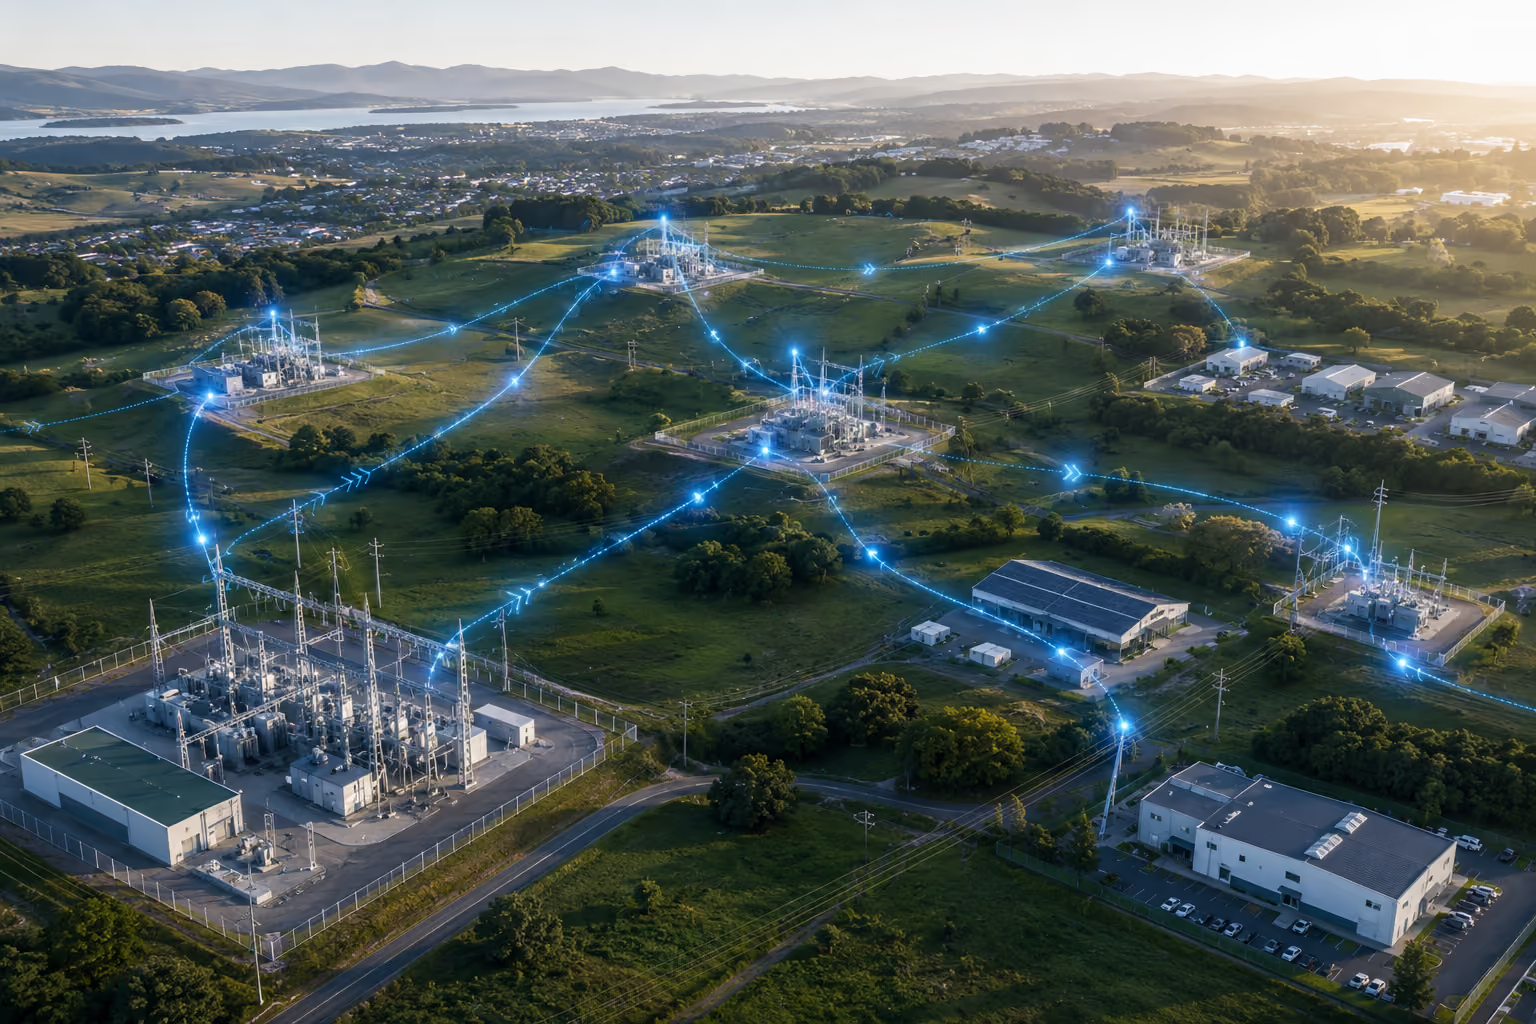
Aerial view of power substations connected with glowing blue network lines across green fields at sunset.

Portfolio Energy
Management

Track and benchmark energy performance across multiple sites from a single platform.

Key Benefits

  • ✓ Centralised energy visibility
  • ✓ Site-to-site benchmarking
  • ✓ Standardised reporting
  • ✓ Performance tracking
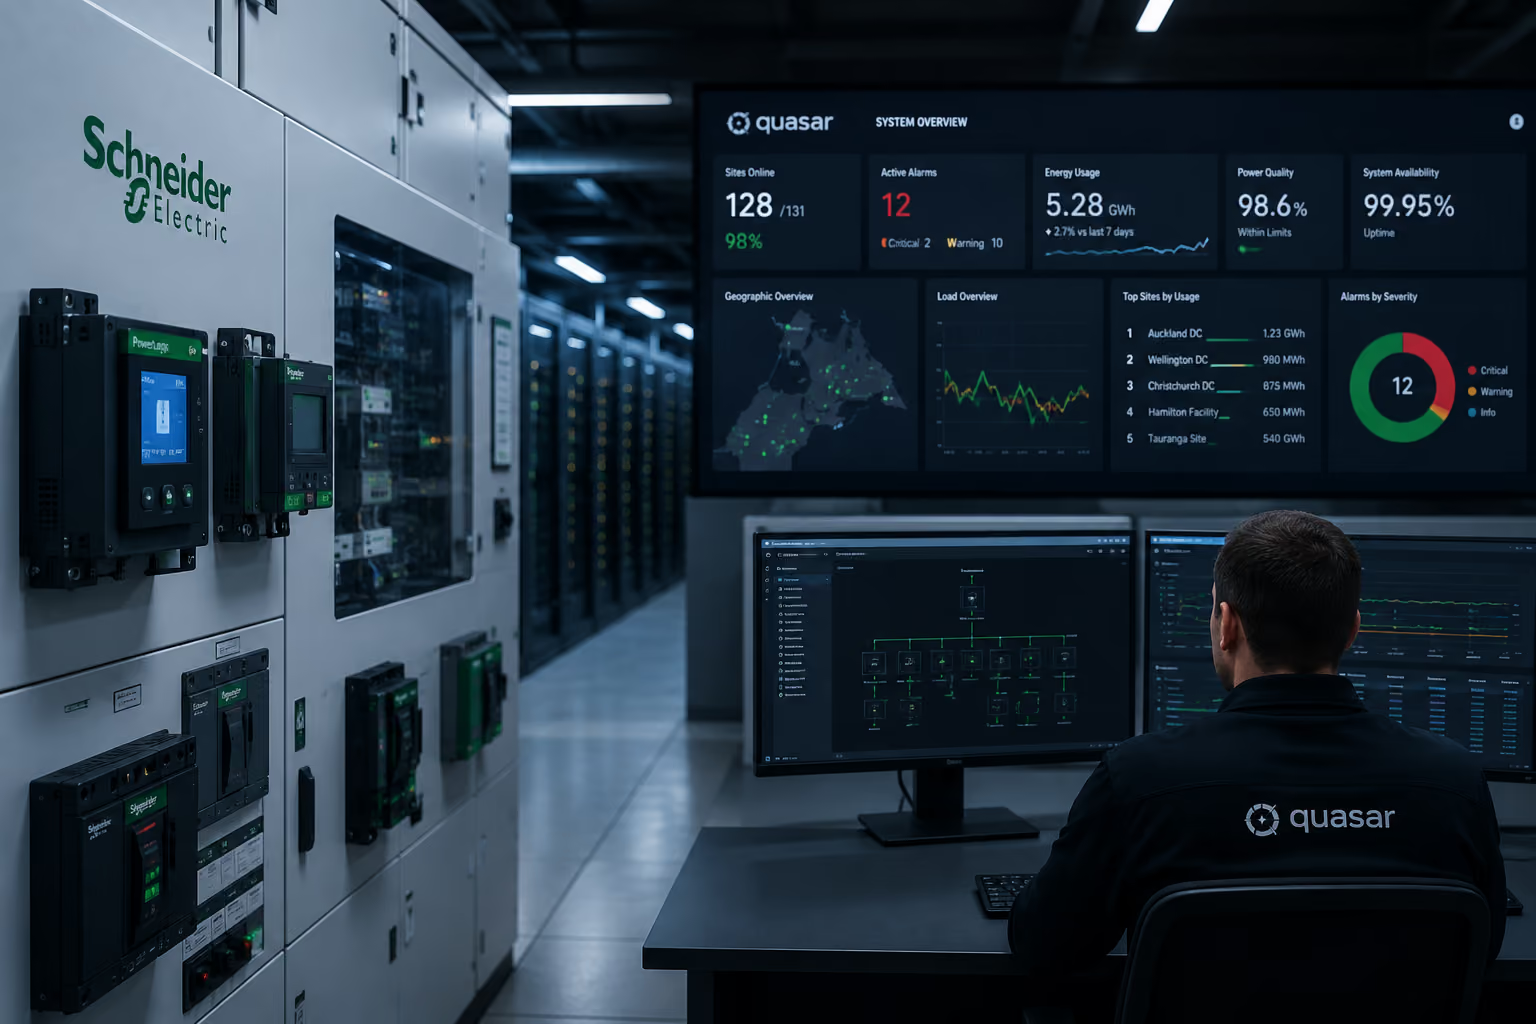
Technician monitoring data center power and system status on multiple screens in a control room.

Cost & Demand
Reduction

Identify inefficiencies, understand demand drivers and reduce energy costs.

Key Benefits

  • ✓ Demand management insights
  • ✓ Energy Cost Analysis
  • ✓ Load Profiling
  • ✓ Opportunity identification
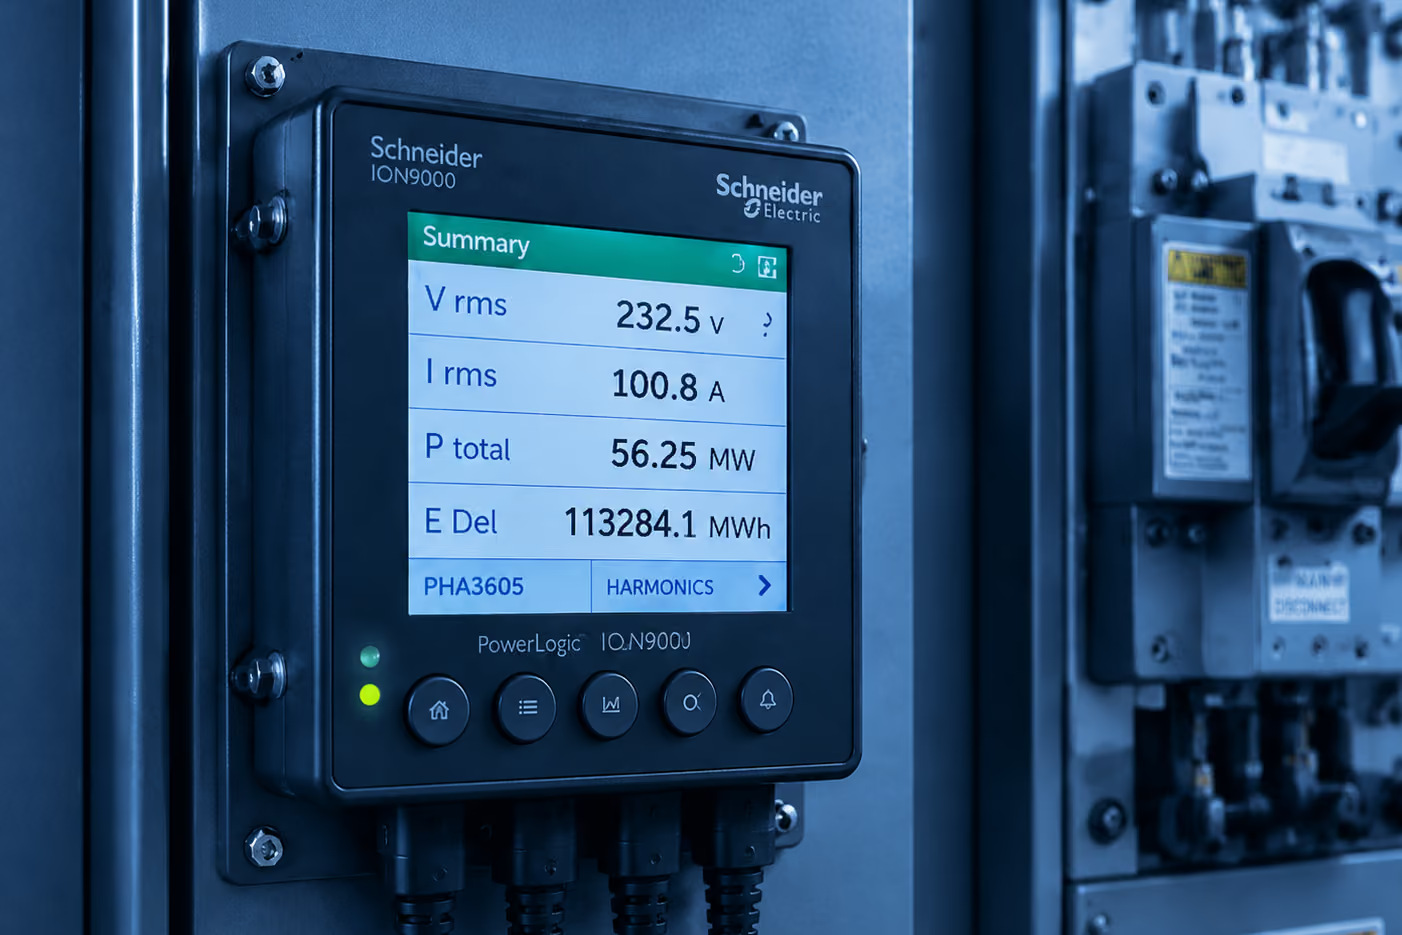
Schneider Electric ION9000 meter showing voltage, current, power, and energy readings on screen.

Power Quality & Electrical Health

Monitor disturbances, harmonics and system performance in real time.

Key Benefits

  • ✓ Harmonic monitoring
  • ✓ Sag / swell detection
  • ✓ Disturbance analysis
  • ✓ Compliance reporting
Engineer wearing a white helmet working on a laptop with multiple data monitors in a control room.

Sustainability &
Reporting

Automate reporting and support sustainability and compliance objectives.

Key Benefits

  • ✓ ESG reporting support
  • ✓ NABERS and Green Star initiatives
  • ✓ Performance tracking
  • ✓ Automated reporting

The Platform to Unlock Visibility

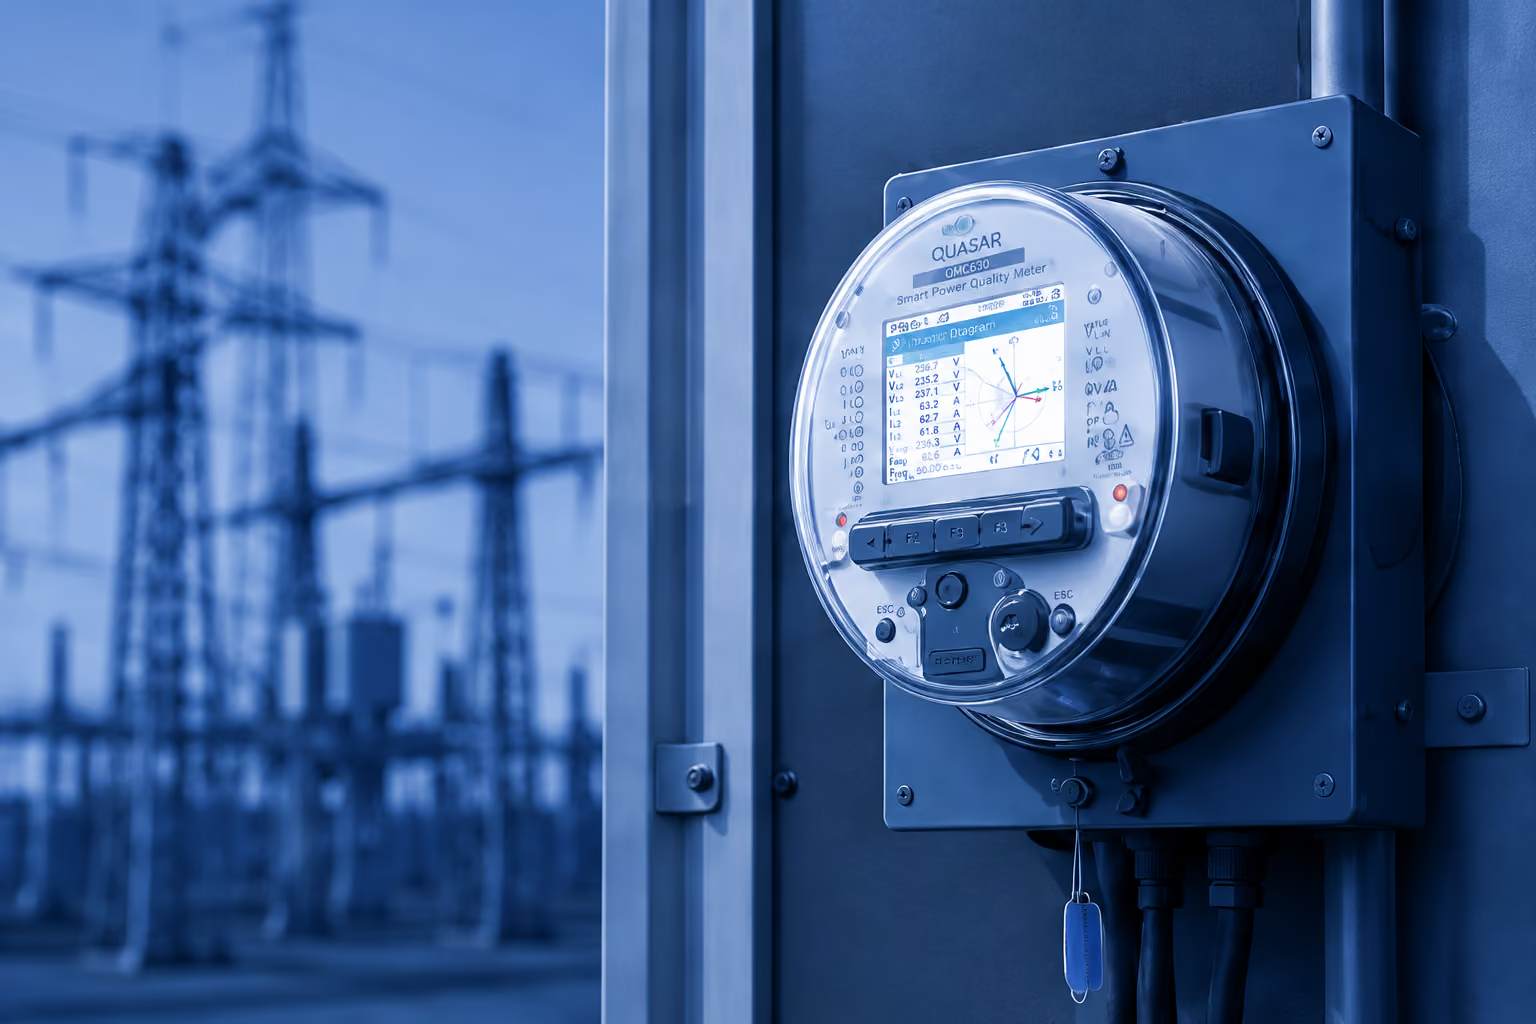
Smart power quality meter mounted on a panel with electrical substation structures in the background.
Icon of a computer hard drive with control buttons inside a blue circle.

Advanced
Metering

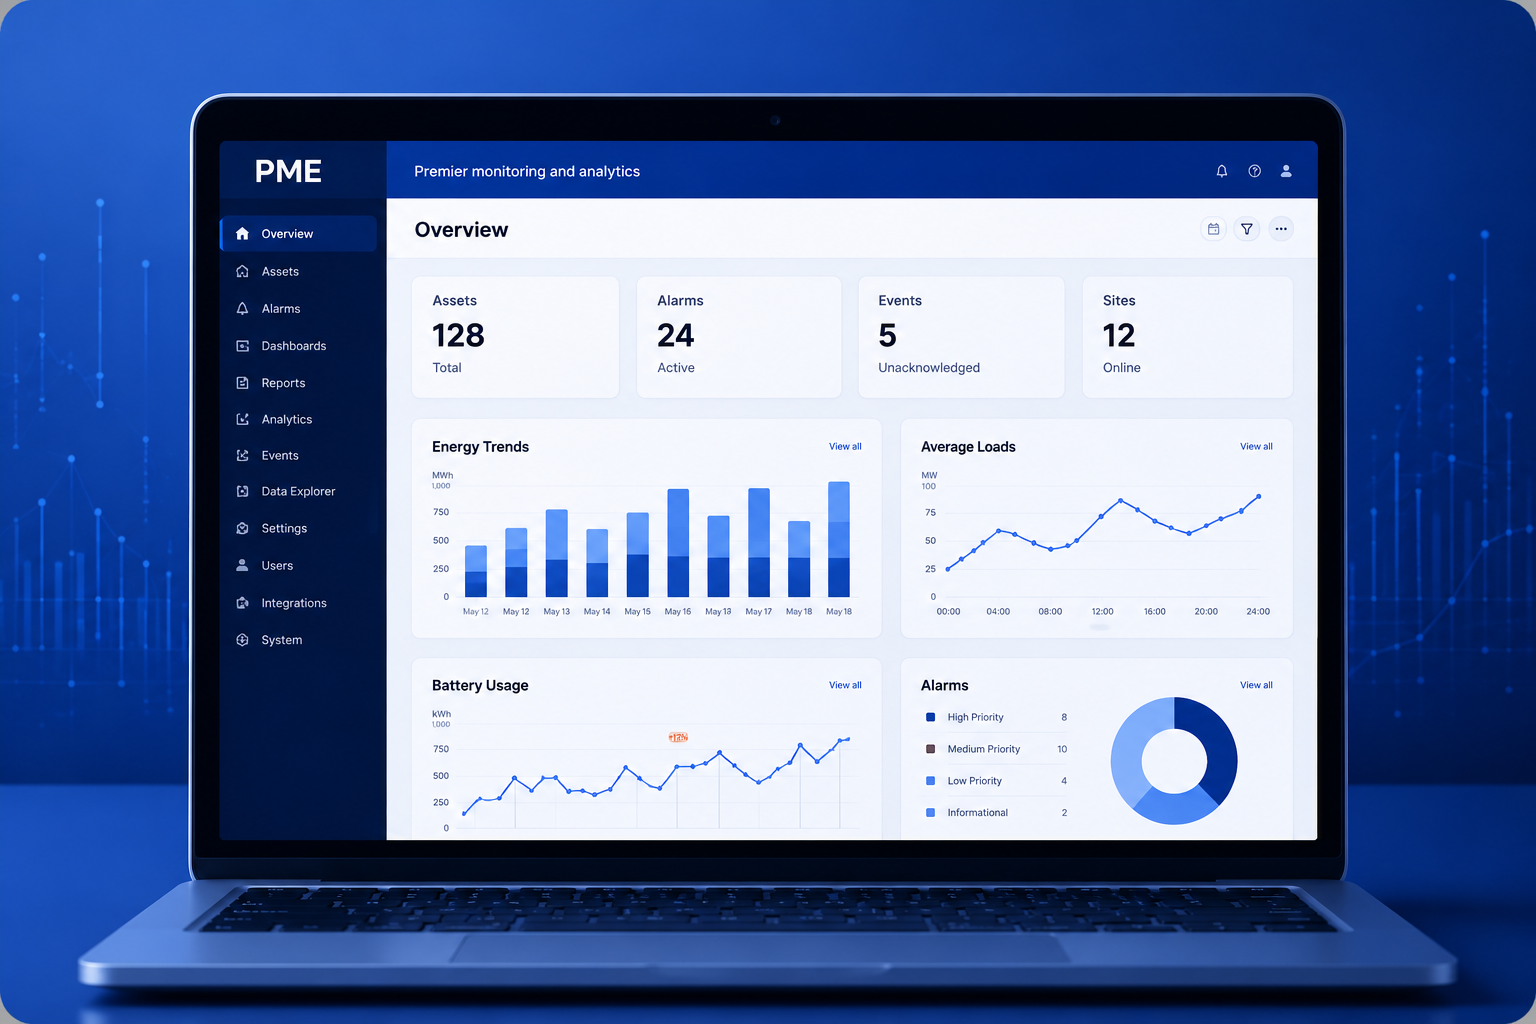
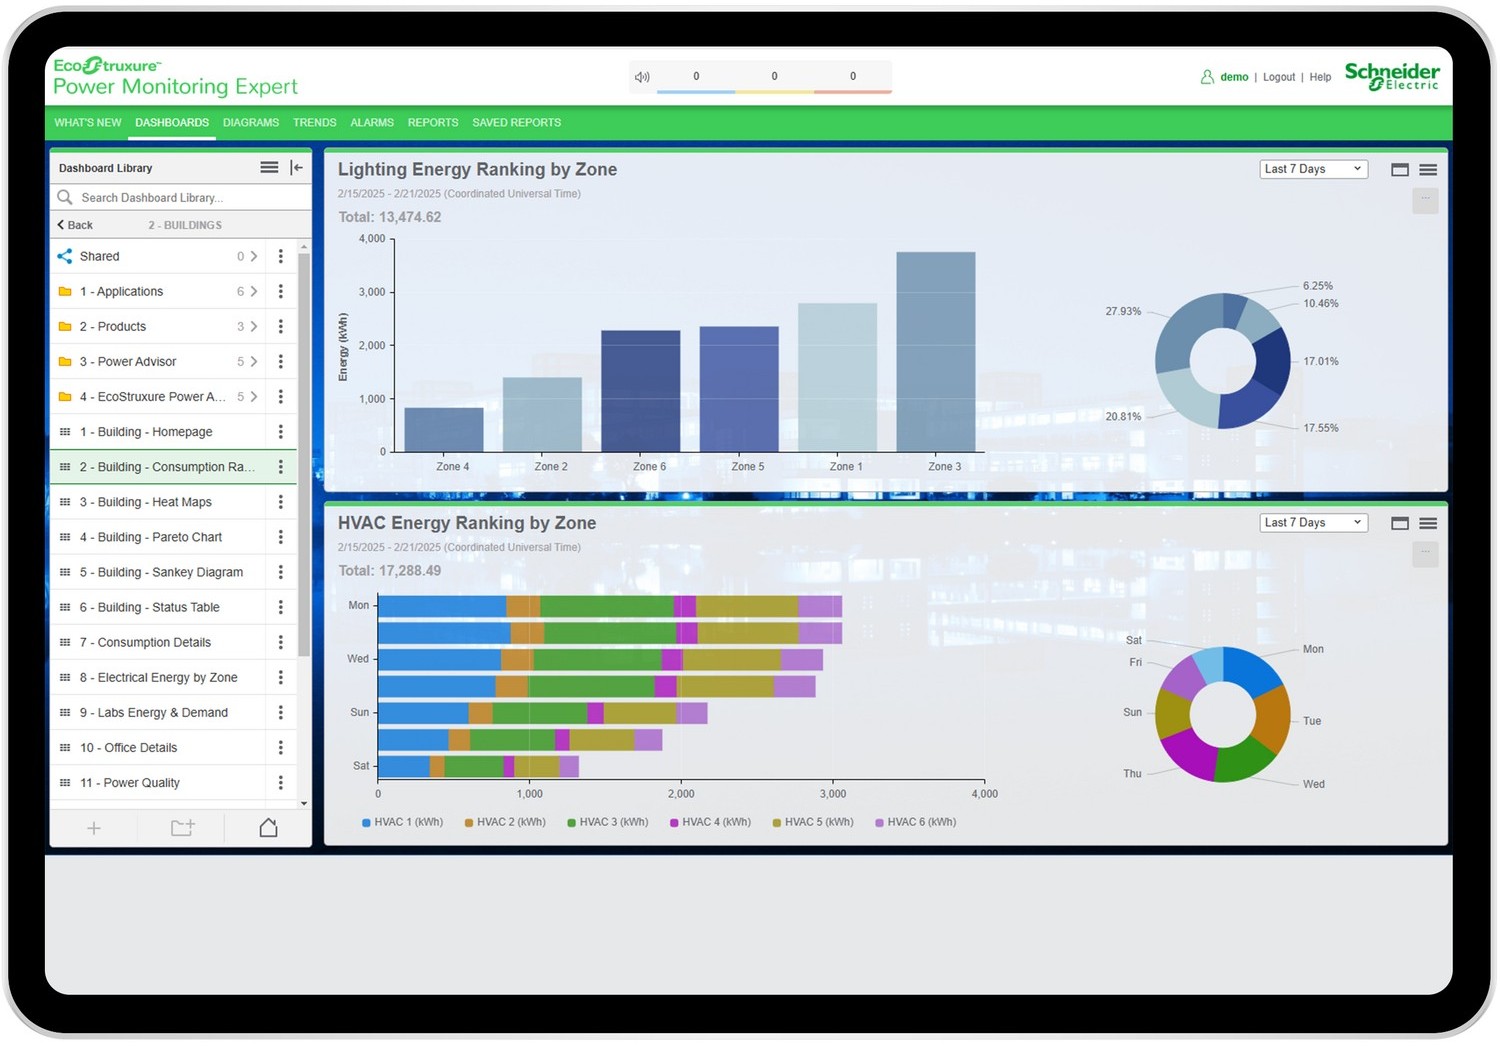
Laptop screen showing PME dashboard with asset, alarm stats, and energy, load, battery usage charts.
Blue line icon of a construction worker wearing a hard hat in a light blue circle.

Centralised
Analytics

Two engineers in hard hats and safety uniforms reviewing data on a tablet at a power plant.
Blue icon of a computer monitor with an upward trending graph and a smartphone beside it.

Engineering & Support

Industries We Support

_______________
Every industry faces unique energy and power challenges. Quasar delivers tailored monitoring, analytics, and power system solutions that improve visibility, reliability, and operational performance across critical infrastructure and commercial operations.
  • 🔵 Utilities & Energy Providers
  • 🔵 Industrial & Manufacturing
  • 🔵 Commercial Buildings & Infrastructure
  • 🔵 Education & Healthcare
  • 🔵 Data Centres
  • 🔵 Government & Critical Infrastructure
Explore Our Solutions

Utility &
Energy Providers

Revenue-grade monitoring for grid visibility, compliance and network resilience.
Learn More

Industrial &
Manufacturing

Energy and power quality analytics to
reduce downtime.
Learn More

Buildings & 
Infrastructure

Scalable monitoring that improves performance and lowers energy costs.
Learn More

Education &
Healthcare

Reliable energy visibility that protects critical operations and ensures compliance.
Learn More

Government & Critical Infrastructure

Secure, compliant energy monitoring
for critical assets and infrastructure.
Learn More

Data
Centres

Power monitoring that protects uptime and supports resilient, efficient operations.
Learn More

Supporting Green Star & NABERSNZ Outcomes

Accurate energy data is essential for building performance, sustainability reporting, and certification programmes.

Quasar's monitoring, metering, and analytics solutions help property owners and operators measure performance, identify opportunities, and support Green Star, NABERSNZ, and ESG objectives.
NABERS Energy logo with stylized letter N and star above it.White line art of a hand holding two buildings on a green circular background.
Blue line drawing of two buildings with windows and a tree on the right side.

Portfolio Energy Visibility

Track energy performance across your portfolio.
Blue gear icon with circular arrows around it representing process or system update.

Tenant & End-Use Metering

Measure & allocate energy consumption accurately.
Blue outlined hand icon with floating digital squares above the palm against a light circle background.

Sustainability Reporting

Support Green Star and NABERSNZ outcomes.
Blue bar chart with ascending bars and an arrow pointing upward to indicate growth.

Electrical Performance Insights

Turn data into actionable efficiency improvements.

Featured Projects

Massey University
Improving energy visibility and efficiency across a major university campus
Blue circular icon with a white lightning bolt in the center.
500,000
kWh Saved
Blue circle with white connected nodes icon representing a network or connections.
120+
Connected Devices
Blue circle icon with white computer screen showing charts, a pie chart, and data lines.
Centralised
Reporting
View full Case Study →
TVNZ
Optimising Energy Costs Through Intelligent Load Control
Blue circular icon with a white lightning bolt in the center.
1.2 MW
Average Site Load
Blue circular icon with two white arrows forming a refresh or sync symbol.
24/7
Auto Switching
Blue circle with white control sliders icon indicating adjustable settings or load type control.
12
Controlled Loads
View full Case Study →
Transpower
National Grid Visibility & Revenue Metering Modernisation
Blue electric meter icon with lightning bolt symbol inside a light blue circle background.
450+
Revenue Meters
Outline of New Zealand connected by a dotted line to four circular nodes in a blue circular background.
150+
Sites Nationwide
Blue icon of a monitor screen showing a waveform and bar chart data inside a circle.
Class A
Power Quality Monitroing
View full Case Study →
Mid-Central DHB
Improving Energy Visibility at Palmerston North Hospital
Blue dollar symbol with circular arrow and downward arrow indicating savings or cost reduction.
$10,000+
Annual Steam Savings
Computer monitor displaying a pie chart and ascending bar graph with lines of text.
Real-Time
Enertgy Visibility
Blue line icon of a hospital building with a medical cross on top inside a blue circle.
350
Beds Served
View full Case Study →

Frequently Asked Questions

What is an Energy Management System (EMS)?

An Energy Management System (EMS) collects and analyses energy data from across your site, providing visibility into energy consumption, demand, costs and performance. This helps organisations make informed decisions and identify opportunities for improvement.

See our Solutions
Icon - Elements Webflow Library - BRIX Templates

Can you monitor multiple sites?

Yes. Quasar solutions can provide centralised visibility across multiple buildings, facilities or sites, allowing organisations to compare performance, consolidate reporting and identify opportunities across their portfolio.

See our Solutions
Icon - Elements Webflow Library - BRIX Templates

How can energy monitoring help reduce energy costs?

Energy monitoring provides visibility into where, when and how energy is being used. By identifying inefficiencies, peak demand drivers and abnormal consumption patterns, organisations can make targeted improvements that reduce energy costs.

See our Solutions
Icon - Elements Webflow Library - BRIX Templates

Can energy monitoring support Green Star and NABERSNZ reporting?

Yes. Accurate energy data is often a key requirement for Green Star, NABERSNZ and broader sustainability reporting initiatives. Monitoring helps provide the visibility and reporting needed to support these objectives.

Talk to us Today


Icon - Elements Webflow Library - BRIX Templates

Trusted by NZ's Leading Businesses

Arise Health logo
The Paak logo
OE logo
2020INC logo
Ephicient logo

Ready to improve visibility across your electrical infrastructure?

Talk to Us today