How Quasar Systems designed and implemented an EcoStruxure Power solution at University of Canterbury to track and manage power consumption and quality and to help foster a culture of energy efficiency.
|
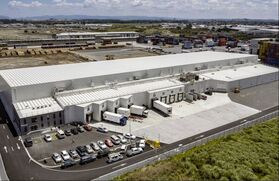
The University of Canterbury occupies a 76-hectare site in Ilam, seven kilometres from central Christchurch. It has around 12,000 students enrolled and its facilities comprises a central complex of libraries, lecture theatres and laboratories, as well as eight accommodation houses providing board for more than 2000 students.
With so many buildings drawing power, it was important for the University to easily monitor its baseload and to understand varying power usage across campus with the aim of reducing consumption. Detecting any supply issues was also crucial, particularly in its Science Faculty, where a number of controlled lab environments operate 24/7. To achieve this insight into its power usage, the University of Canterbury invested in upgrading its energy monitoring software across campus. |
|
|
GOAL:
An adaptable and accurate power monitoring system that provides visibility, reduces risk and improves energy efficiency. SOLUTION: A customisable power management software solution using EcoStruxure™ Power Monitoring Expert RESULTS:
|
|
A clearer picture
|
“The University of Canterbury really wanted a detailed understanding of their power usage, so they put in programs to increase efficiency, make cost-savings, protect plant and help drive an energy efficient culture,” says Lucas Lormans, Technical Sales Engineer at Quasar. “We had to work out how much of the university they wanted to monitor and to what level of detail; what sort of data they wanted to get out of it and how they wanted it presented in terms of the dashboards and reporting.”
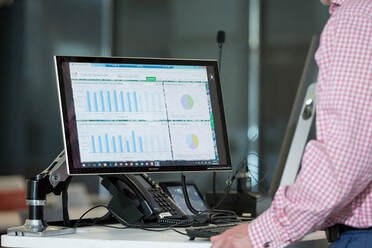
The software solution Quasar presented lets the university see what is occurring in terms of power consumption, demand and quality across every metered area of the campus. PowerLogic ION7650 meters on all main incoming supplies capture significant data in terms of power quality and overall usage, while intersect breakers downstream add a finer level of detail. The university can create customised dashboard reports based on the level of detail it requires: from usage by department, down to individual buildings, or even specific floors. |
|
“It gives us a very clear picture of what we’re using. We’re now starting to meter down to lighting and power circuits, so splitting the consumption per floor was the latest roll-out in our newest buildings. We can locate big consumers and can tell whether it’s lights being left on or people plugging in appliances and leaving them on overnight, because we can differentiate between our lighting circuits and our plug circuits."
Matt Young, Building Controls Specialist at the University of Canterbury.
|
Matt says the system helps to shine a light on a crucial aspect of the University’s operations. “If we didn’t have it, we would never know what was happening [electrically],” he says. “It would be really hard to track where any problems are. I’ve created a number of dashboards for our Energy Manager on campus so he can log in and at a glance he can see which substation is currently drawing the most power.”
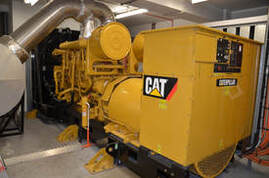
Lucas says the Power Monitoring Expert software is highly configurable and each system is customised to each client’s needs. “We do all sorts of very specific dashboard reporting for clients all the time, and the software is easy to use, and it looks great. The software is so configurable it works well on both the supply and demand side. We’ve got a number of systems across New Zealand; these systems range from generators and lines companies on the supply side through to industrial and commercial sites on the demand side.” |
|
Quality and risk
As well as consumption, the software allows the University to easily monitor power quality too – an essential element for facilities management.
“We use it to monitor disturbances,” says Matt. “When we get a power blip we can see if it’s come from somewhere on campus or if it’s external… we can differentiate between the two and respond accordingly. It definitely helps Facilities Services in terms of power outages and power quality… we know which buildings are suffering from quality issues or harmonic disturbance.”
Lucas says the quality analysis reports allow for quick reaction to anomalies and can help with predictive maintenance. “If a particular area of the university is being affected by significant harmonic distortion, and this is affecting a certain type of plant, then they can correct that with harmonic filters, or replace or repair the equipment that’s being affected, prior to it failing.”
A culture of energy awareness
Matt says the goal is to foster a culture of energy efficiency in staff and students, and this is being helped by the Power Monitoring Expert system. “The dashboarding allows us to get buy-in from staff, to monitor their usage and to see what they’re doing. It’s quite a new initiative so it’s not rolled out across campus yet, but our target is to have that information available to staff – and students if they want it – so they can see how the university is tracking with regards to power consumption.”
The University of Canterbury now has complete visibility of what is happening electrically across its campus. It can monitor its baseload, track usage down to fine detail and identify anomalies in power supply and quality. Customisable dashboard reporting means it can also raise awareness amongst staff and students around power consumption to assist with energy efficiency. The system also allows the University to bring new buildings online as campus development continues.
Schneider Electric products used
- Power Monitoring Expert software
- PM8000 advanced power meters
- Compact NSX circuit breakers with energy trip units
- Com’X 510 energy servers